Debunking the Climate Scam
Billions of Dollars -
Greedy Green Corporations -
No Warming For Two decades -
Bought and Paid For Organizations

5000 Years Of Climate Change From Greenland Ice Cores

Posted on August 1, 2010 by Anthony Watts
Guest post By Girma Orssengo, MASc, PhD
Comparison of the claims by the Intergovernmental Panel on Climate Change (IPCC)
of 1) “Most of the observed increase in global average temperatures since the mid-
FIRST IPCC CLAIM
In its Fourth Assessment Report of 2007, IPCC’s claim regarding global warming was the following [1]:
Most of the observed increase in global average temperatures since the mid-
Let us verify this claim using the observed data from the Climate Research Unit (CRU)
of the University of East Anglia [2]. In this claim, “mid-
To verify the claim that global warming since 1950 is mostly man made, we may compare the global warming rate in degree centigrade (deg C) per decade in one period before 1950 to that of a second period after 1950 to determine the effect of the increased human emission of CO2. To be able to do this, we need to identify these two periods, which may be established from the Global Mean Temperature Anomaly (GMTA) data of the CRU shown in Figure 1.
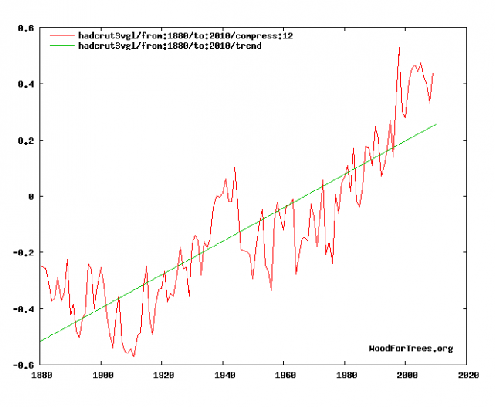
Figure 1. Annual surface Global Mean Temperature Anomaly in degree centigrade from year 1880 to 2009 from the Climate Research Unit of the University of East Anglia [2."
In Figure 1, the GMTA could be visualized as the sum of a Linear GMTA that has an overall warming rate of 0.6 deg C per century and an Oscillating GMTA that oscillates relative to this overall linear warming trend line. This Oscillating GMTA indicates the relative warming and cooling phases of the globe.
As our objective is to verify the claim that global warming since 1950 is man made,
we need to identify two global warming phases before and after 1950. To clearly see
the global warming and cooling phases, we plot just the Oscillating GMTA, which is
the GMTA relative to the overall linear warming trend line shown in Figure 1. This
can be done by using an online software at www.woodfortrees.org by rotating the overall
linear warming trend line to become horizontal by using a detrend value of 0.775
so that the Oscillating GMTA has neither overall warming nor cooling trend. The noise
from the Oscillating GMTA is then removed by taking five-
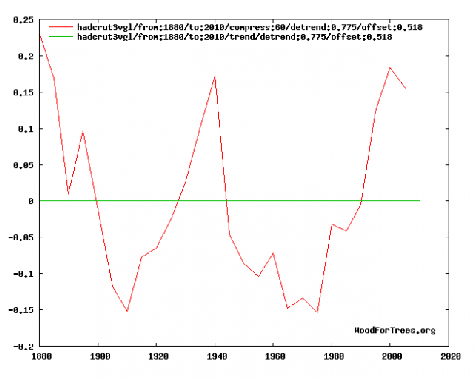
Figure 2 shows the following periods for relative global cooling and warming phases:
1. 30-
2. 30-
3. 30-
4. 30-
If this pattern that was valid for 120 years is assumed to be valid for the next 20 years, it is reasonable to predict:
1. 30-
Figure 2 provides the two global warming phases before and after 1950 that we seek
to compare. The period before 1950 is the 30-
Figure 2 also provides the important result that the years 1880, 1910, 1940, 1970, 2000, 2030 etc are GMTA trend turning points, so meaningful GMTA trends can be calculated only between these successive GMTA turning point years, which justifies the calculation of a GMTA trend starting from year 2000 provided latter in this article.
Once the two global warming periods before and after mid-
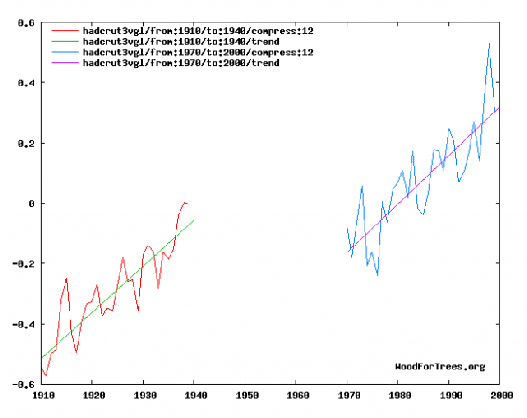
According to the data of the CRU shown in Figure 3, for the 30-
Read the rest of this proof at wattsupwiththat.com
A primer for disproving IPCC’s theory of man made global warming using observed temperature data
| Warming Stopped |
| NOAA Data |
| NorthWest |
| Oregon |
| Washington |
| Extreme Weather |
| Past Was Warmer |
| NASA: 30's Hotter |
| PastBeliefs |
| HistoryOFAlarmism |
| Central England |
| Temperature History |
| MultiProxy |
| treemometers |
| Northwest Passage |
| Acidification-Ball |
| Acidification-Fulks |
| Acidification-Idso |
| Selected Emails |
| CRU Emails - html formatted |
| CRU Emails Simple Format |
| CRU Emails UnFormatted |
| DCPS paper |
| CRU_Files_Notice |
| False Deadlines |
| Hockey Stick Links |